Build Interactive Timelines
Transform your digital content into an interactive journey through time — fast, fluid, and built for large collections.
Scroll to explore
Transform your digital content into an interactive journey through time — fast, fluid, and built for large collections.
Selected projects from museums, libraries, universities, and cultural organizations.
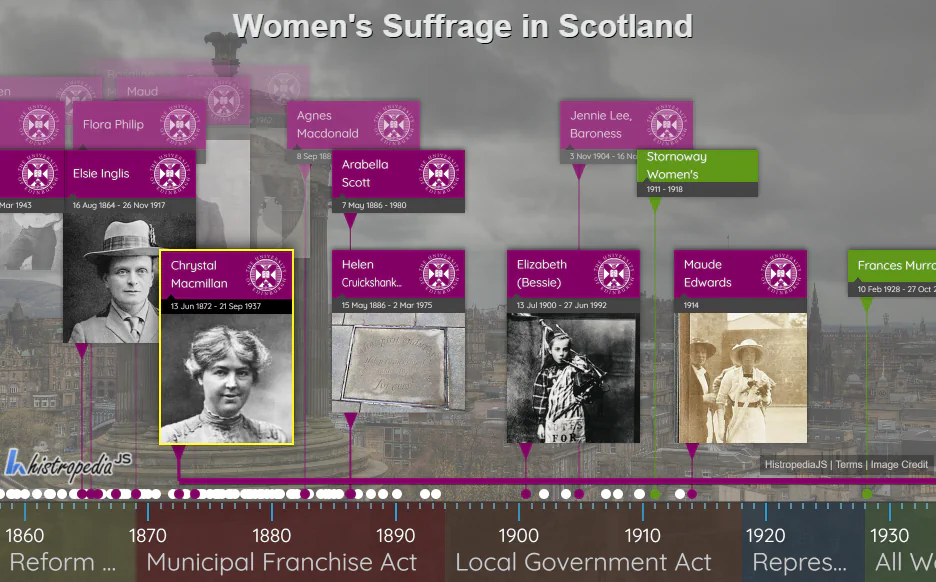
Created for the #Vote100 celebrations, this interactive display highlights women’s suffrage history and was showcased on campus.
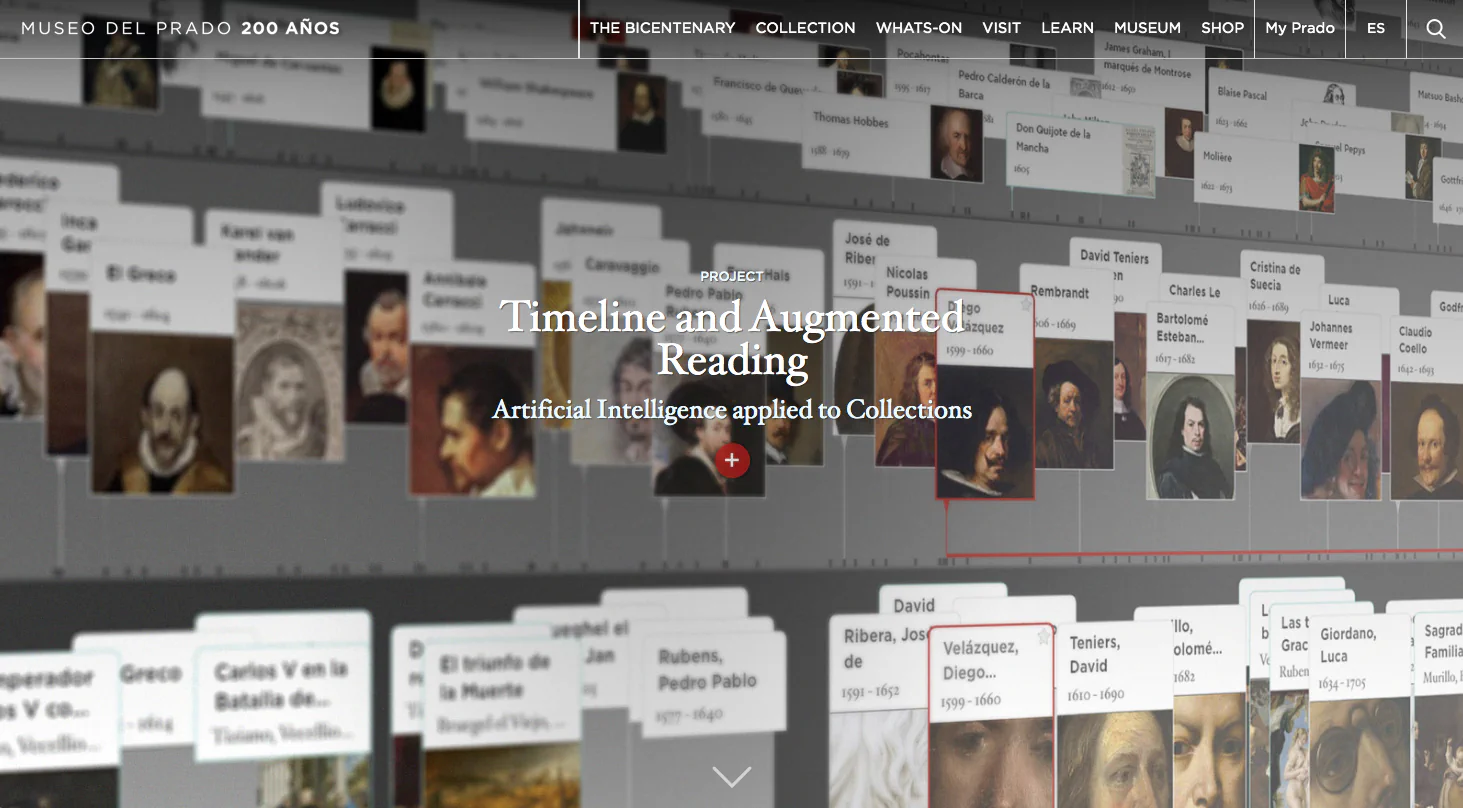
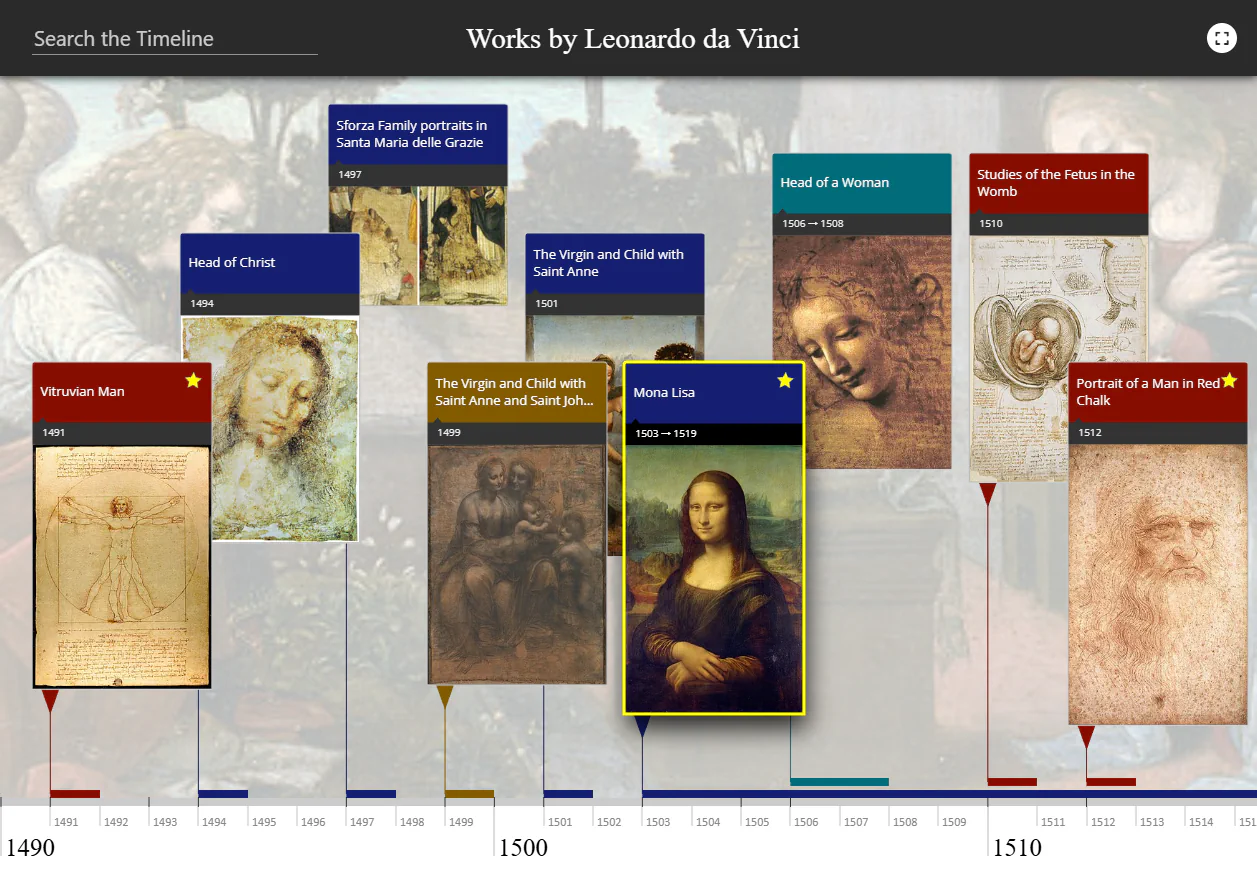
A digital exploration of the entire Museo del Prado collection, placing every artwork in its historical context, launched for the museum’s bicentenary.
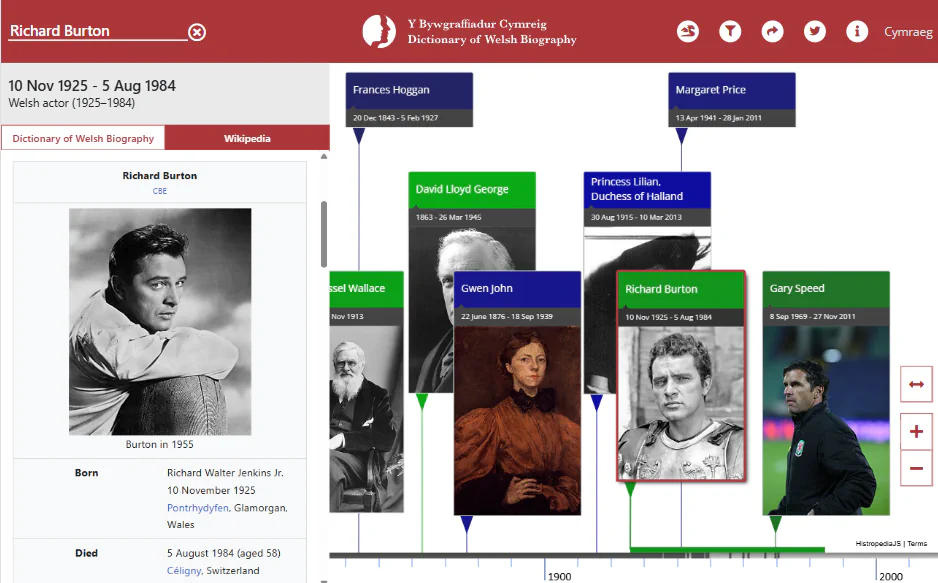
Powered by Wikidata, this living visualization features over 4,000 lives from the Dictionary of Welsh Biography at the National Library of Wales.
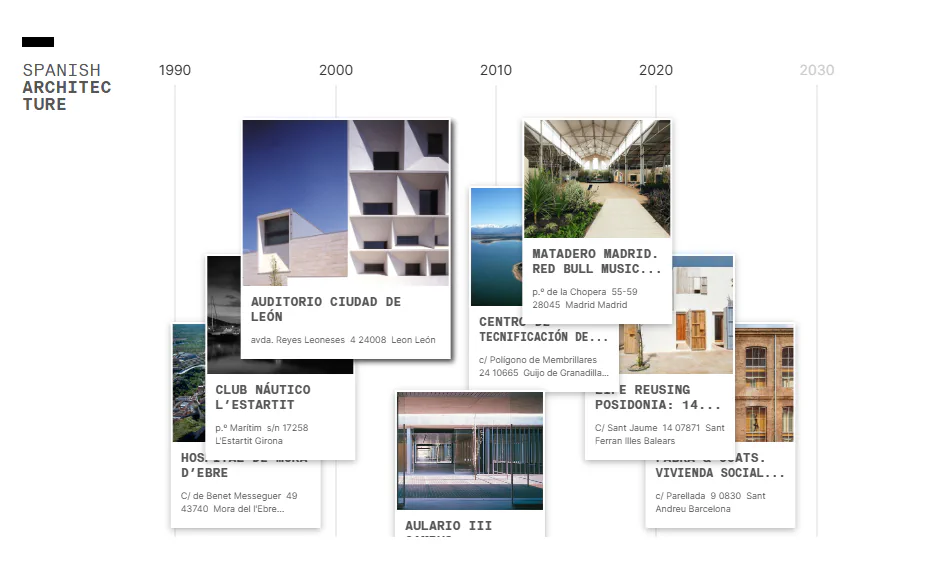
An interactive catalogue for ES_ARQ, presenting Spain’s architectural heritage in historical context and connecting past and contemporary practice.
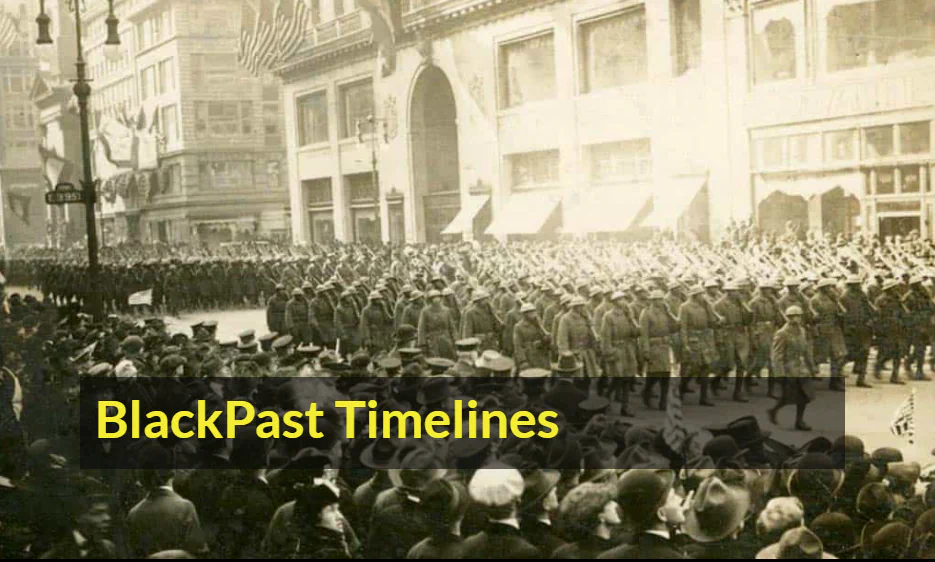
A series of timelines tracing African American history and global Black heritage within the wider story of civil rights and social change.
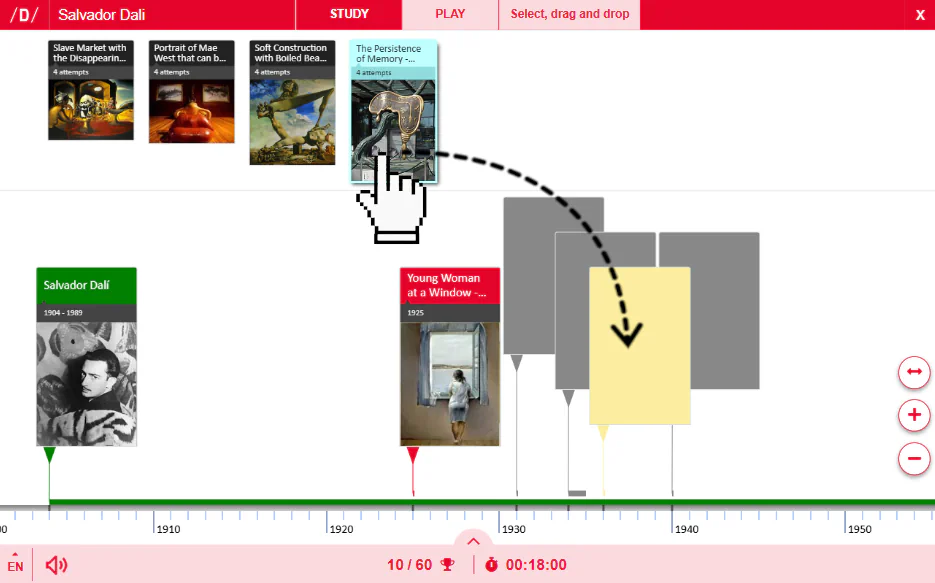
An innovative drag-and-drop timeline game from Didactalia, where users learn through play across a wide range of historical and educational topics.
Performance and flexibility for data-rich timelines.
Render 10,000+ events at 60fps with a tuned canvas engine proven in production.
Built-in touch, scroll, zoom, pan, and hover for responsive timelines on any device.
Match your brand with rich style options, custom layouts, and full control over rendering.
Plain JavaScript that works via script tag or bundler, with no extra dependencies.
<script src="histropedia.js"></script>
Practical APIs, clear documentation, and friendly support.
Method-by-method reference with practical examples.
Spin up your first timeline in minutes with starter templates.
Full type definitions and editor hints for modern stacks.
import { Timeline } from 'histropediajs';

const container = document.getElementById('timeline');

const timeline = new Timeline(container, {
  width: 1000,
  height: 500,
  initialDate: { year: 1989, month: 3, day: 12 },
  zoom: { initial: 34 },
});

const events = [
  {
    id: 2,
    title: 'World Wide Web',
    subtitle: 'Tim Berners-Lee proposal',
    from: { year: 1989, month: 3, day: 12 },
  }
];

timeline.load(events);
Create interactive timelines in minutes — no coding needed, fully synced with Google Sheets.
Histropedia Sheets lets you create and manage HistropediaJS timelines without writing any code. It connects directly to a Google Sheets spreadsheet, updating your timeline automatically whenever the data changes. Collaborators can easily add or edit events using only basic spreadsheet skills.
Connect your spreadsheet, choose the columns for titles, dates, and media, and your timeline is ready — no coding steps or installs needed.
Each time your timeline loads, it refreshes from Google Sheets, keeping every change instantly up to date.
Use the columns you already have to create categories, color scales, or filters that make your data easier to explore.
Add extra context with columns for Wikipedia, YouTube, custom embeds, or your own text and HTML content.
Publish your timeline as a standalone page, or embed it seamlessly into any website or intranet.
Perfect for digital collections, education projects, and collaborative timelines that evolve over time.
Interact with the embedded timeline above — it’s powered by live data from this Google Sheets spreadsheet.
Follow the quick start and publish an interactive timeline in minutes.